Abstract
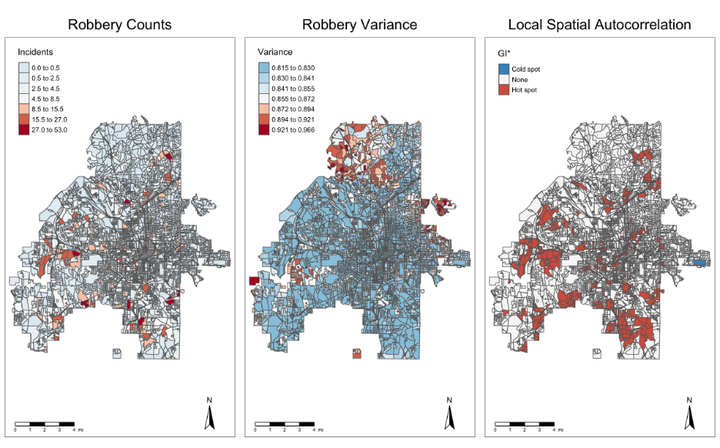
Spatial analysis is central to crime science, yet the primary medium used to communicate spatial findings remains the static map. While static cartography effectively illustrates broad spatial patterns, it is often limited in its ability to convey hierarchical, multi-scale, or temporally dynamic crime phenomena. This study evaluates the extent to which contemporary crime-and-place research relies on static visualization and assesses when dynamic mapping would meaningfully enhance interpretability. A scoping review of 930 eligible studies published between 2010 and 2024, with a 10% random sample coded for mapping characteristics (n = 93), reveals that although 77% of studies include maps, interactive or dynamic visualizations appear in fewer than 5%. Based on explicit decision rules, 62% of coded studies were classified as clearly or partially appropriate for dynamic visualization. To demonstrate the practical implications of these findings, crime incident data from Atlanta, Georgia are used to develop interactive maps illustrating hierarchical spatial variability across census blocks and tracts. The demonstration illustrates how dynamic visualization can improve multi-scale interpretation, supports exploratory spatial analysis, and reduces reliance on multiple static figures. By repositioning visualization as a methodological component of crime science rather than a purely descriptive tool, this study highlights the analytical and translational value of dynamic mapping for researchers and practitioners.